The day began at 5am sampling our cores again. Nothing more fun than starting the day in a walk in fridge. There was a genuine feeling of doing science though.
Throughout the night we had to measure the oxygen levels in each tube at 3 hour intervals to see what is happening over a 24 hour period. Following that we ran all our sliced samples from yesterday, which have been bathing in acetone for the last 24 hours through a centrifuge to get all the mud to the bottom.
Throughout the night we had to measure the oxygen levels in each tube at 3 hour intervals to see what is happening over a 24 hour period. Following that we ran all our sliced samples from yesterday, which have been bathing in acetone for the last 24 hours through a centrifuge to get all the mud to the bottom.
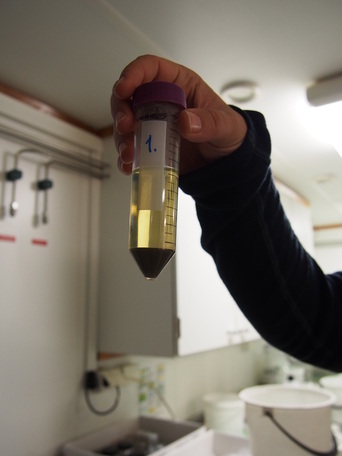
Sample post centrifuge
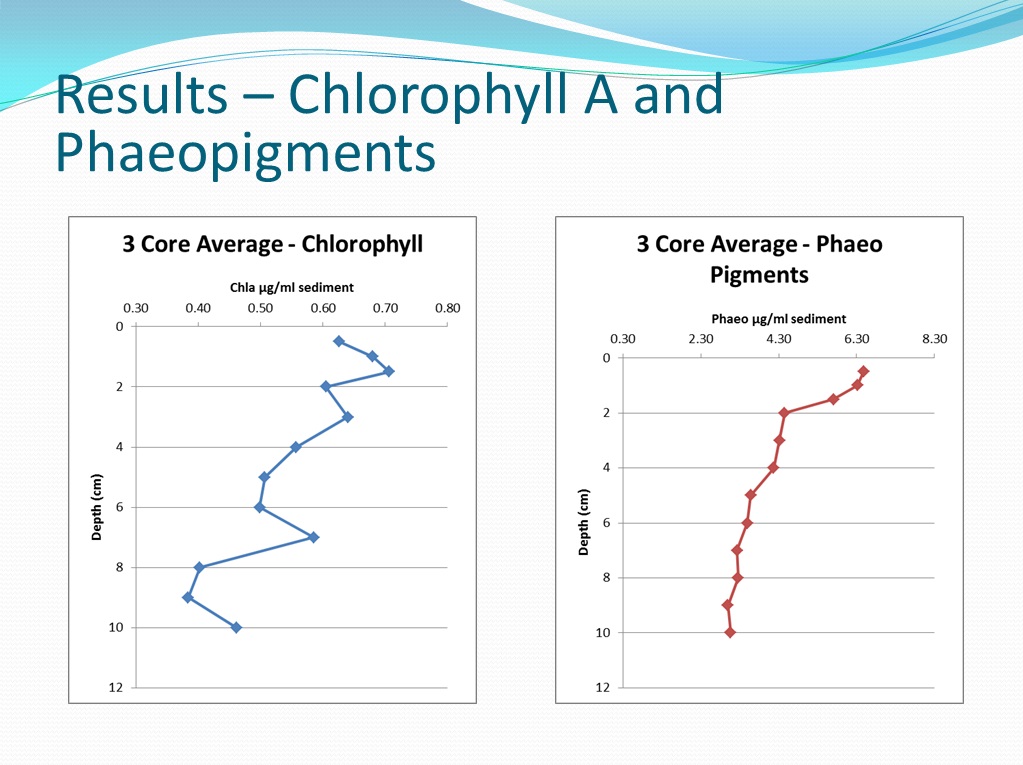
From there the samples are fun through a flurometer, this is to test the amount of organic matter, both living and dead, that was in that layer of sediment. The amount of organic matter is expected to decrease with depth. Basically what happens is that the little creatures that live in the sediment transport their bits of food (or “organic matter”) up and down through their layer of mud. As there are less creatures that dig deep there is less food down lower. Our results didn’t show this perfectly neatly, which could be caused by a number of different factors including say if a bit of worm ended up in the sliced layer or just some really active deep burrowing creatures. So you can see our results below. Basically they show how there is less and less organic matter as you go down, this is to a depth of 10cm. So the graph on the right is the dead organic matter, or the organic matter that has been munched, chomped and digested by some creature. The graph on the right shows all the “living” or undigested organic matter as measured by its chlorophyll content which doesn’t follow such a nice curve, but it means that there could be something a bit different going on down there around the 12 cm mark. It was quite awesome to actually get to take data and analyse it and then to present it.
To understand this movement of bits and pieces up and down through the mud we also added some fluorescent pink beads to the tubes. This will measure the “bioturbation” or the movement of particles that the little creatures get up to. They will take some pink beads down to the level they like to hang out in and then in a week when that core is sliced and analysed they will be able to see if there are any particularly deep burrowing creatures or some such.
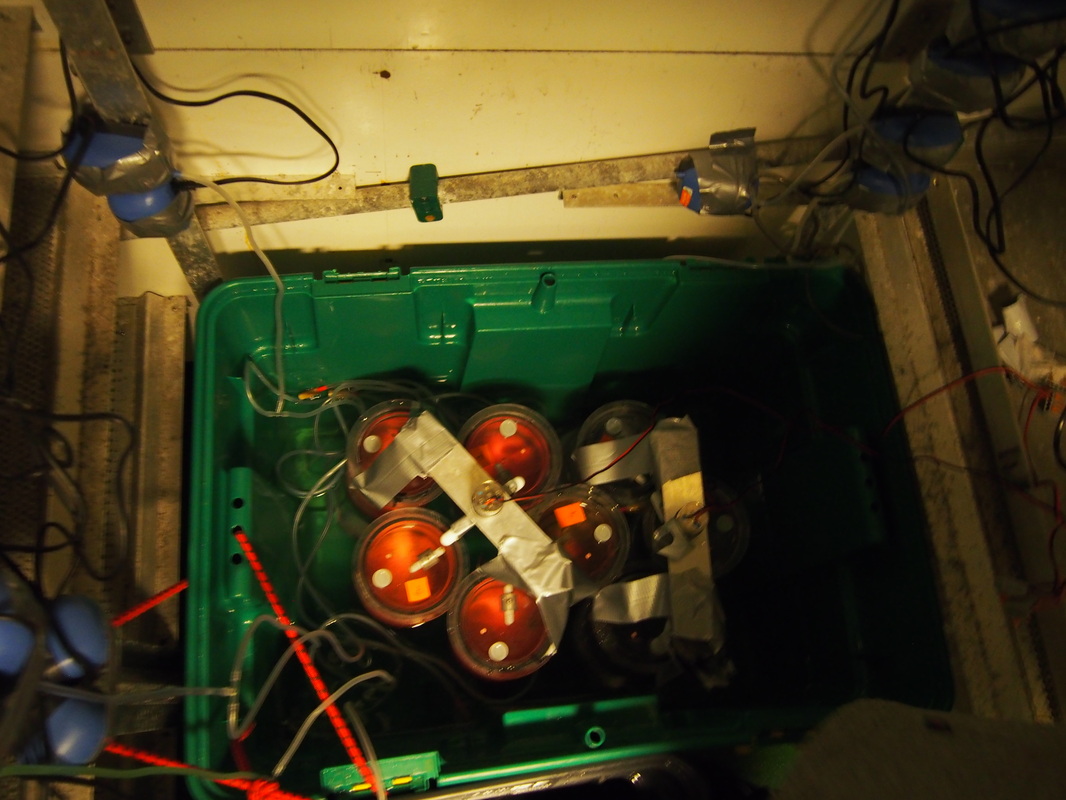
Samples with bioturbation beads ontop (the bottom of the ocean is not usually bright pink..)
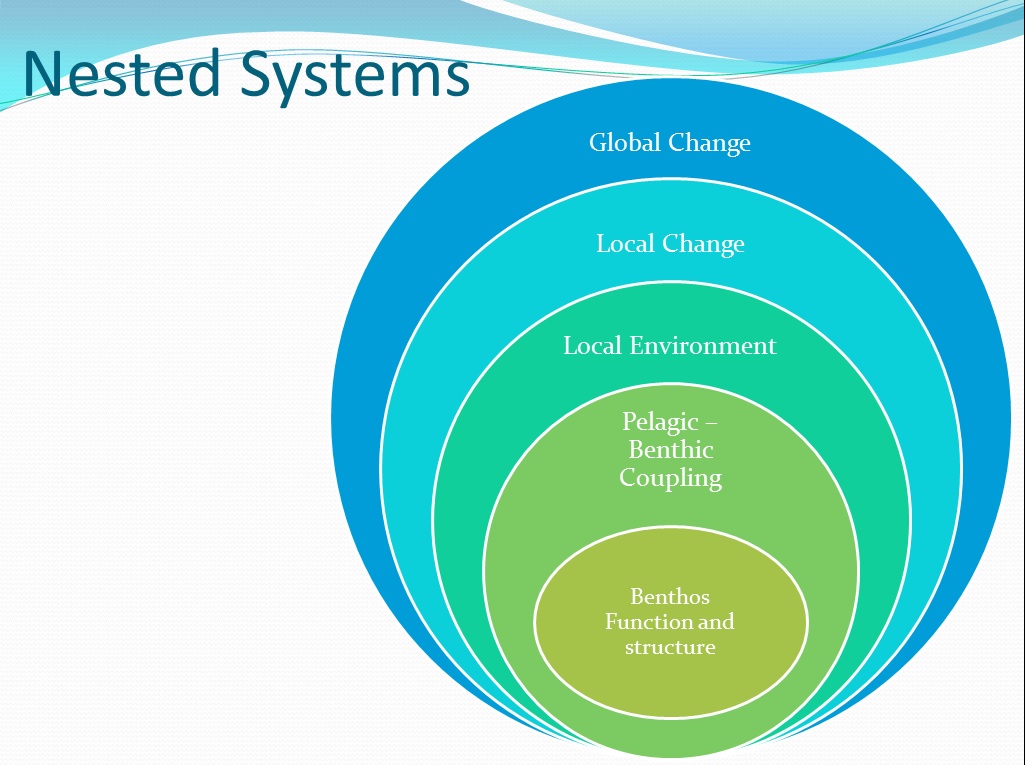
The majority of our day was spent putting together a presentation about what we had been up to and trying to analyse our data and consider what it might mean within the bigger picture. Because I like to think about things as systems I put together a little image to help this make more sense. The image below basically just shows how there are different systems at different scales, from global to local, and they are interacting. You can’t consider what’s happening at a local scale without considering what’s happening nearby and globally. All these factors are working together, and rarely are they working in the same direction. Looking at it like this can help to keep it all in perspective, every little bit of bioturbation is important for the bigger picture.
Our presentation went down really well, and we then only had to do a little bit of data entry and then the same testing as we did last night with the DIC, the DOC and some nutrients. This experience, complete with the French pop music played to keep spirits high was converted into the last part of our project which was to draw a cartoon of our experience. I was involved with the DIC which involved mercury chloride, which is a particularly deadly substance, if ingested. Hence the “I’m going to die” bubble. However, I didn’t die, so all is well. It was really only if I ate the vial or my gloved I would die, and to be fair.. if I did that even without the Mercury Chloride I’d be likely to die anyways. Good general rule, don’t eat the lab equipment.
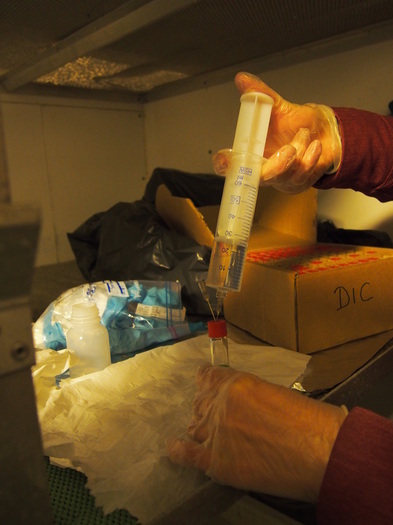
Mercury Chloride in action
And to see what I was actually doing with the DIC, in the big syringe is the sample water, in the little tube is an inert gas (think back to year 10 chemistry) and some mercury chloride. The challenge is to fill the little bottle with the sample so the second needle is to let out air and the mercury chloride. Its actually an astonishingly tricky thing to do because you have to try and get every little air bubble with this needle, and they often hide. Not a task for the faint hearted on a moving ship at night. French pop music does actually help though, and knowing you can tell all your friends you were risking your life for science.
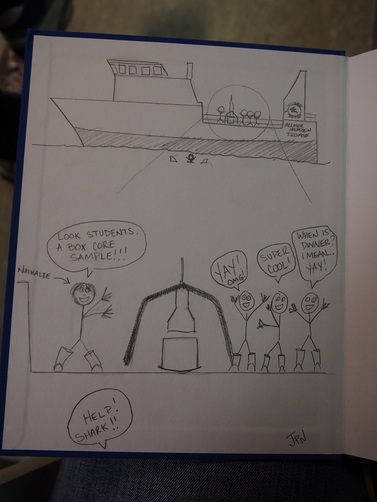
The first group's cartoon
You can also tell that this is a research vessel by the ships track, it really doesn’t appear to make any sense at all. But that’s the ship trying to get into the right position and then hold position for various activities such as dropping the CTD which is a relatively delicate piece of equipment that has to be located on the leeward side when it is lowered. This often means that the ship has to be parallel to the waves rather than the more comfortable perpendicular, and can lead to some really odd feelings inside the ship. In some cases the ship is also trying to hold steady for the people who are dropping moorings or fixing moorings. Moorings are permanent mini research stations which either mark a location to come back to so we can do research over time, or are taking samples and sending that information back to land at a regular basis. There are a lot of different kinds of moorings which means a lot of different things can go wrong with them. Either way, it ends up with a very squiggly ship track.
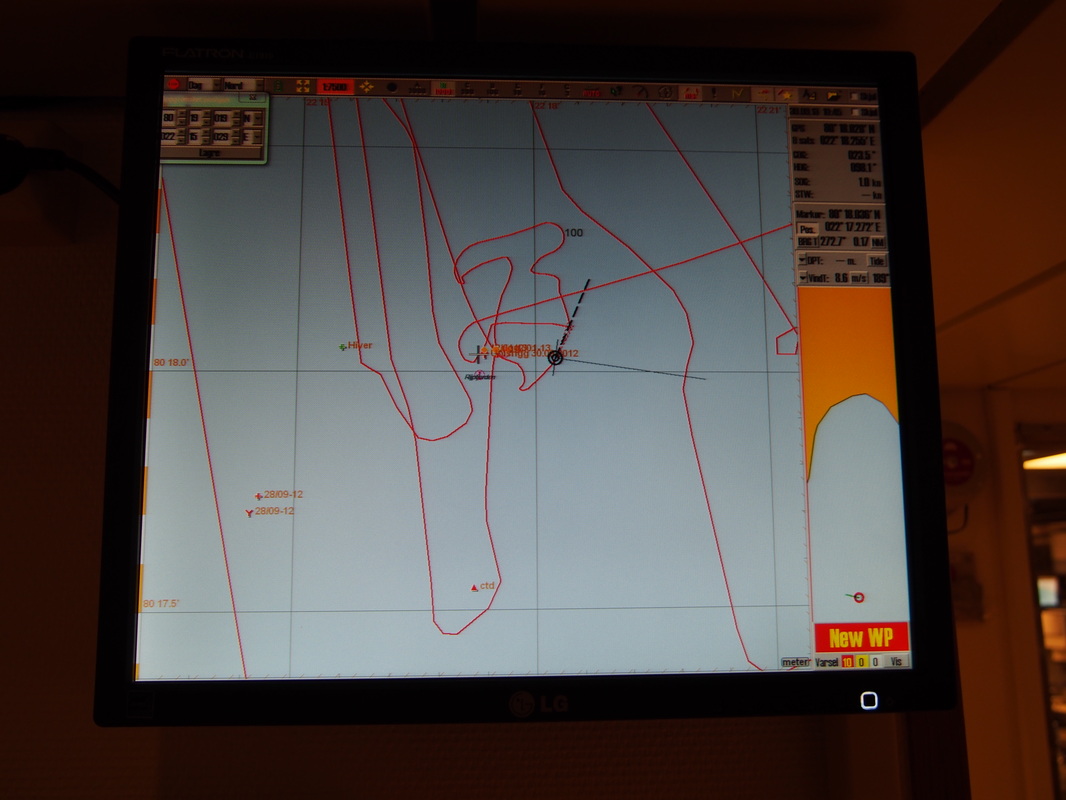
The red line is the ships track
Our lecture this evening was about the management of Norwegian coastal waters, which because of Svalbard and some other small islands in the North Sea they have a lot of. The waters have a lot of oil and fish which are a key part of the Norwegian economy, so the sustainable management of these resources is essential. It was very interesting to hear how they approach their management, with multiple research voyages annually and very scientifically calculated quotas for fishing. It would be interesting to compare this to how Australia manages our fisheries, because we have much fewer research vessels. It’s also interesting hearing about the claims that different countries are making to the North Pole and their attempts to prove this through the nature of the sea shelf. If you can prove that there is a constant linkage between your landmass and are X (ie. The North Pole) then you have a chance at claiming it. A similar battle is happening down in the South with Australia and France and some others looking to strengthen their claims to Antarctica with underwater maps. Australia has a number of voyages planned for late next year to do some sea floor mapping to add to our claim.
Everyone finished a bit early tonight which was great, although some of us made the mistake of celebrating this early finish by staying up late to enjoy some free time. It was not the wise choice, although we did learn a lot about what it’s like to work on scientific research vessels as a Norwegian researcher.
Everyone finished a bit early tonight which was great, although some of us made the mistake of celebrating this early finish by staying up late to enjoy some free time. It was not the wise choice, although we did learn a lot about what it’s like to work on scientific research vessels as a Norwegian researcher.
 RSS Feed
